How we calculate overflight

How we calculate overflight

You can easily determine if an aircraft is overflying your area by looking at the tail. If you can see the tail, the chances are the aircraft is too far away from you to be counted in our statistics. The following two videos explain how you can determine overflight and how our system calculates location-specific data used on this website.
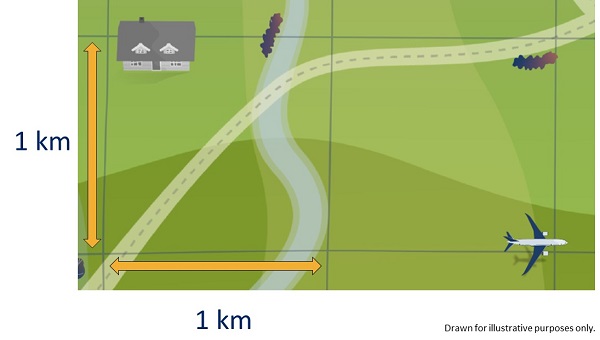
1km x 1km grid over the local area to show how we divide up our analysis

The grid

To be able to analyse the number of flights over an area around the airport, we have created a grid of identically sized, 1 kilometre by 1 kilometre squares. In total, the grid extends for 40nm (nautical miles) around the runway, ranging from certain identified towns and landmarks. 40nm is approximately the extent of our radar coverage and the data in our noise and track keeping system (ANOMS).

How we count the number of flights

We start by drawing a cone in the centre of each grid. Using the location that you provided when you entered the site, we determine the nearest cone to you.

Flights that pass through each cone are recorded and that data is presented on this website.

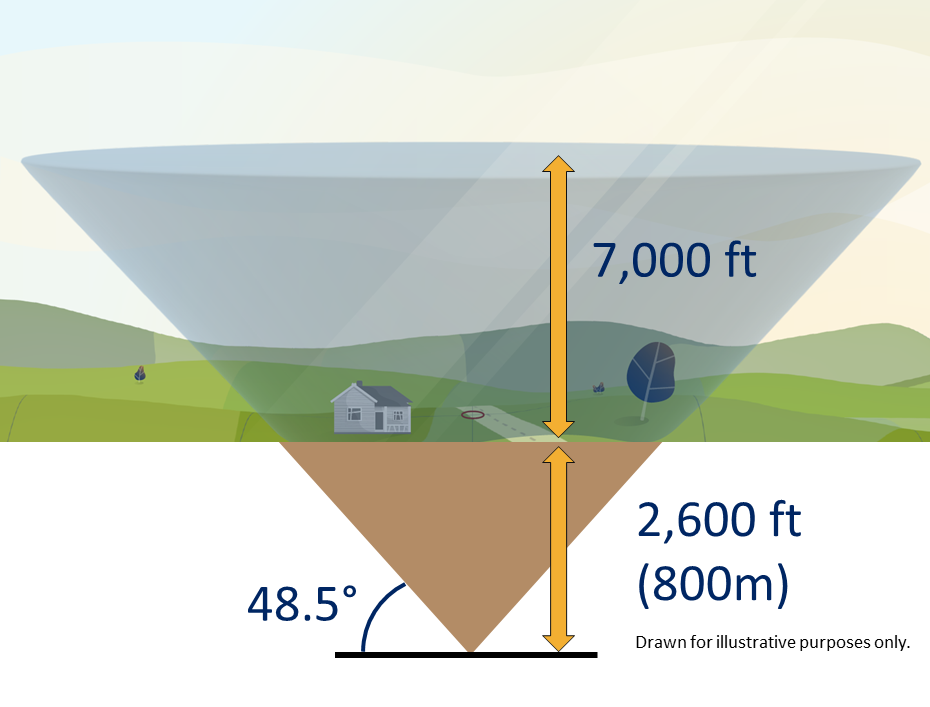
To ensure we capture as much overflight data as possible and to fully cover all locations in our grid, we have lowered the cone by 2,600 feet (800 metres) into the ground. This is to ensure that all locations within the 1km grid are captured by the cone that extends above. The cone extends up to 7,000 feet (2.1 kilometres) above local ground level and at the very top, the cone is over 5 kilometres wide. This is for indicative purposes only and therefore differs from the CAA methodology for calculating overflight, as used in support of the London Stansted Airport airspace change proposal.

Why we use a cone

We use a cone at a 48.5 degree angle because research undertaken by the UK Civil Aviation Authority (CAA) identified that a cone best aligns with how we determine if an aircraft has overflown a location or not.

The 48.5 degree angle of the cone was selected as it incorporates an evaluation of noise, in that if one aircraft flew directly above the observer, followed by a second aircraft off to the side along the 48.5 degree line, the second aircraft would be 3 decibels quieter than the first.

Where does the data come from?

All data used in our system comes directly from our Aircraft Noise and Operations Monitoring System (ANOMS), which receives flight data from Air Traffic Control radar.

Detailed dashboard for your area

Detailed dashboard for your area

This dashboard provides information about how regular and frequent flights are in your area as well as their altitude.

We also include information about what kind of aircraft they are by aircraft category. Where appropriate, overflights from other airports are shown.

There are many different classifications of different aircraft types. Examples of aircraft that fall under each category are:

  • Jet: Boeing 737-800
  • Turbo Propellor: ATR 72
  • Propellor: Cessna 152
  • Business Jet: Cessna 525 Citation
  • Regional Jet: Embraer E195

Please note this is not an exhaustive list. Further aircraft information can be found here.

If you have changed your location, please refresh your web browser.

How high are flights in my area?

How high are flights in my area?

The altitude of aircraft can vary due to a number of factors. It could depend on which airport the flight is going to or from, and whether it is an arrival or departure. Arrivals are typically following a steady descent to the runway whilst departures are typically following a steeper path as they climb away from the runway.

A core function of Air Traffic Control (ATC) is safety, and one of the primary ways in which this is achieved is by maintaining either horizontal or vertical distances between aircraft. This chart shows the height of aircraft overflying your area in 1,000ft increments. Hover your mouse over it for more figures and details. A dropdown menu allows you to view historical months for comparison and trends. The data is refreshed monthly, generally in the middle of the month.

How frequent are flights in my area?

How frequent are flights in my area?

There are a number of factors that influence the frequency of flights:

  • The number and frequency of flights will vary on a daily, weekly, monthly, and yearly basis due to differences in airline schedules. The airlines schedule flights in response to consumer demand. This is particularly the case around holiday periods.
  • The runway in use at any given time will also vary, largely due to the wind conditions. The runway can operate in an Easterly or Westerly direction. Each runway direction has its own set of flight paths, and each flight path will affect different areas. As the runway in use changes, the flight paths change, and so do the areas affected.

This chart displays the average number of flights per day of the month or per hour. Use the toggle to switch between the graphs. Hovering your mouse over the chart shows more details, with historical months available via the dropdown. The data is refreshed monthly, towards the middle of the month.

Noise Data (All Areas)

General Noise

Most us experience a variety of sound on a daily basis. According to the Cambridge Dictionary, noise is defined as a sound that is unwanted, unpleasant, or loud.

Noise is not only about how loud the sound is. There are a complex set of factors that drive annoyance both based upon the noise itself and what that noise means to us. A dripping tap is mostly quiet, but it’s repetitive beat can be annoying. A mosquito’s buzzing is also quiet, yet it is high pitched.

Sounds rarely occur in isolation. It is when we build a combined picture of all of the day-today sounds such as traffic and wind, that we start to identify noise. Certain noises, such as a siren, can be easily heard above the day-to-day sound. Other noises may only be heard when the background level is lower, such as during the night. These principles also apply to aircraft. Whilst the sound level will vary depending on your location, what that sound means to us individuals will drive our response to the resulting noise.

London Stansted Airport Noise Data

To understand the noise impact on the local community, the airport has a number of fixed or temporary noise monitors deployed in the local area, generally under or near flight paths. The monitors detect and record the noise levels 24 hours a day, 7 days a week to ANOMS.

A ‘noise event’ is created when the monitor detects noise exceeding the background or local noise level for a noticeable amount of time. This could be due to any number of factors, be it nearby birds, cars or an aircraft. By continuously monitoring the noise level and integrating data from Air Traffic Control (ATC) our systems work to determine if the noise event was generated by an aircraft, or another source. Only events reported as aircraft noise events are reported in our statistics.

The data collected by all of our fixed noise monitors is presented in the dashboard below.

Choose a noise monitor location in the top left hand corner to get started. See our ‘How we manage noise’ page (under the “What are we doing” heading) for more information about noisy aircraft penalties. A number of our noise monitors positioned directly below the flight path are used for fining aircraft on departure and the noise limits are calibrated with respect to the height and distance of the runway to the monitor location.

The dashboard is automatically updated every month and you can access data from previous months using the drop-down. A comprehensive list of aircraft types can be found here.